Visualize and map your systems, environments and cloud hosting provider data
Businesses are increasingly running ERP on cloud platforms with providers like AWS, Microsoft Azure and Google Cloud Platform.
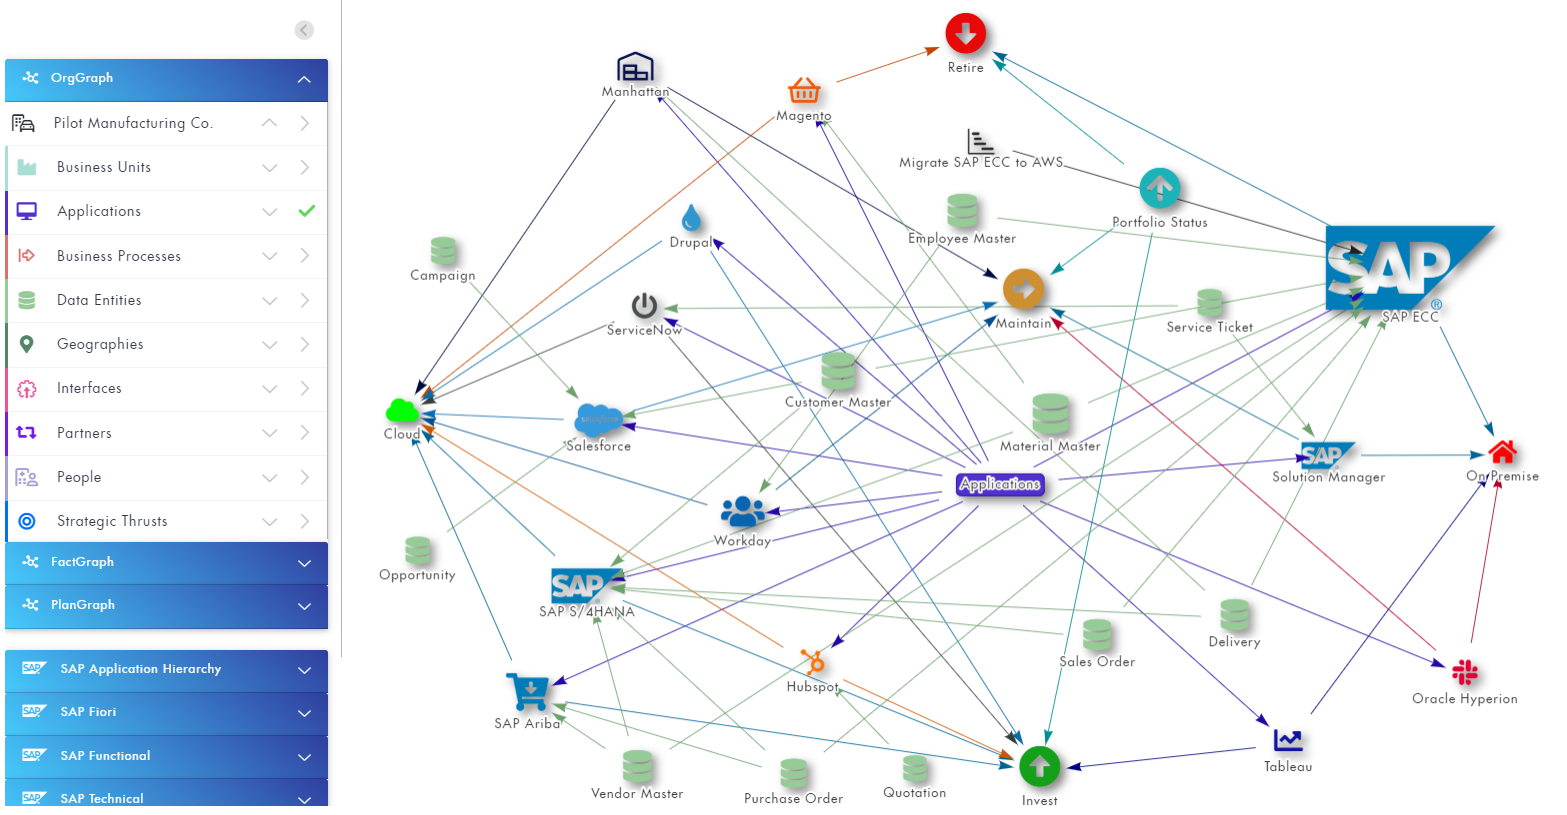
FusionGraph make its easy to visualize your cloud environments, the systems and data hosted within them, and the roles and teams responsible for managing them.
This puts all the important information about your cloud services in one place.
Plan and manage projects to migrate to cloud providers
If you're in the process of moving your ERP systems to the cloud you need a way to manage those projects.
FusionGraph lets you visualize your tech landscape in as-is and future states so you can clearly see how and when each application will be moved to the cloud and the projects and teams responsible.
Understand the impact on applications, interfaces, data and business processes
When you move applications and data to the cloud it will transform the way you access that data, and how the systems interface with each other.
FusionGraph helps you to visualize these changes and run change impact analysis to understand what will be different once your applications and data are in the cloud.
More Information
For more information on how to explore and visualize these scenarios please refer to the other use cases documented in this section.