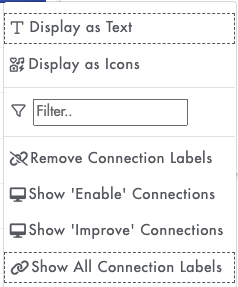
This section covers how to use the Connection Filter and the different Display Options for layer filtering.
Relationship Filtering Overlays
In the Card view it is possible to use OrgGraph, FactGraph or PlanGraph filters to overlay multiple connected items and provide more context to cards, such as its Applications and Geographies
- Select a layer to overlay from the OrgGraph, FactGraph, PlanGraph or Datasets Filtering section.
- Click the half moon button
located to the right of the layer you wish to overlay. Any overlay that you apply carries over if you navigate around the card view.
- You can remove the overlay by pressing the tick button for that layer
.
- You can filter the overlay and change the display options by clicking the cogs
button for that layer.
Note: Any filter you have applied will carry over when navigating within this view.
Display Options

Display as Text - Displays the names of connected items for the filtered layer.

Display as Icons - Displays the icons of connected items for the filtered layer, the name of each icon can be seen when hovering over.
![]()
Filter - You can search for a key word to only show connected items associated with the key word. (e.g. 'SAP' would only show connected items that have SAP in their name).
Remove Connection Labels - Removes the connection type of the filtered layer e.g. improve/enable labels have been removed but the connected items are still shown.

Show Individual Connections - Only show one connection type on the Card Builder e.g. show 'Enable' Connections will display all 'Enable' connection types and remove the 'Improve' connection types.

Show all Connection Labels - Shows all connection types of the filtered layer e.g. improve/enable will both be shown.

Note: Display as Text & Show all Connection Labels are the default options.
Cross checking with Classifications
Overlaid connections can be used with multiple classification filters to build out a comprehensive view of the data within one view that can be snapshotted and shared for validation.
.png?height=120&name=fusion-graph-white%20(1).png)