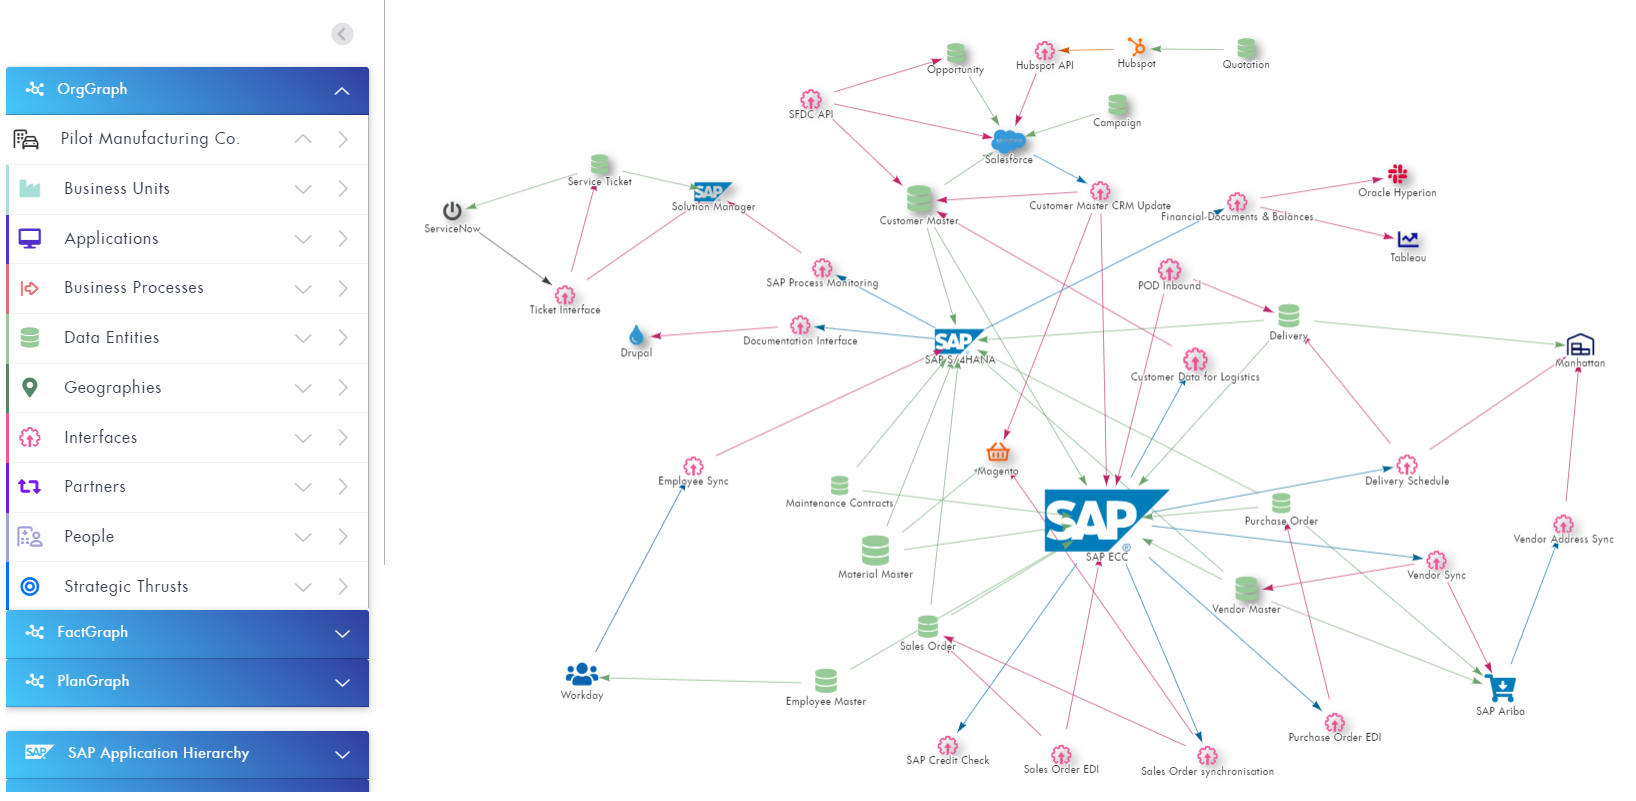
Manage a central repository of all of your applications along with an enterprise wide interface diagram.
Document your corporate data model along with where that data is being used.
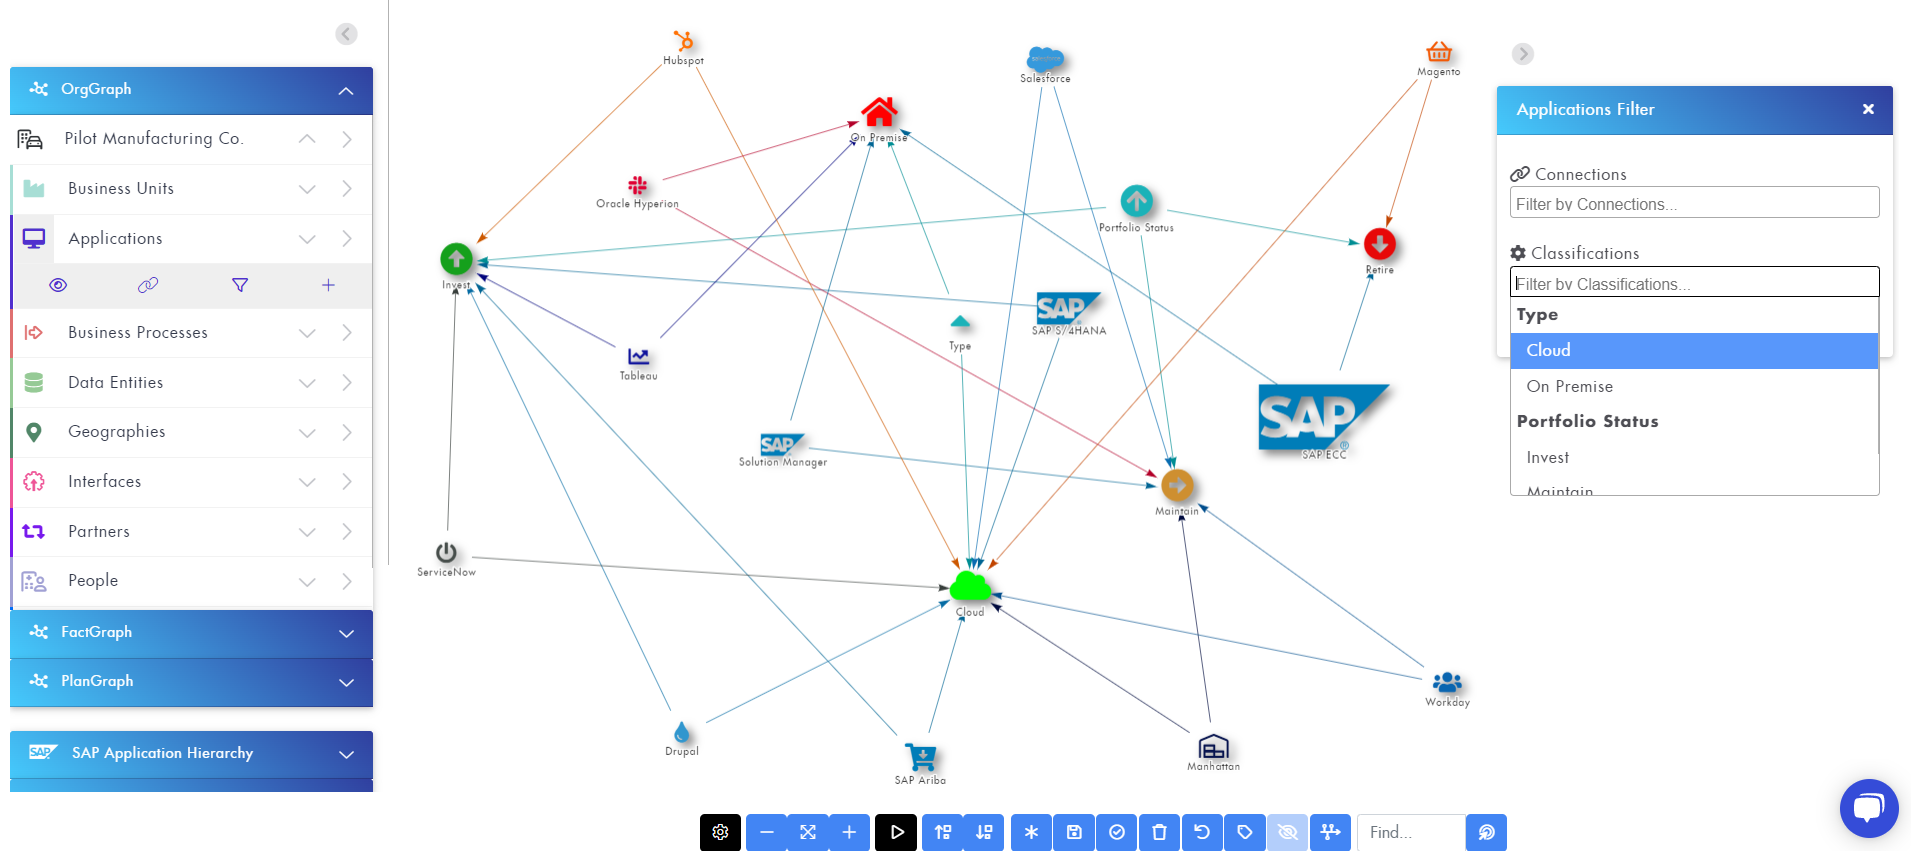
Categorise your applications, interfaces and data entities to manage classifications like cloud / on-premise, interface frequency, data type / protection.
Benefits
Centralize all the elements of your technology and your data model so you have an accurate, up-to-date and fully connected inventory.
Understand who the owners and users are for applications, interfaces and data (both internal and 3rd parties) to improve decision making.
Understand your data model and where data is being used and impacted.
Visualize how your technology landscape will evolve over time as projects, programmes and transformation activity takes place.
How can I do this in FusionGraph?
- Draw your imported Applications, Interfaces and Data Entities on the Canvas and impact asses against Business Processes, People or Partners to view the inter-connections.
- Add new items, assign classifications & connect to your FusionGraph Landscape.
- Activate the Time Machine function to view the change in state from ‘As Is’ to ‘To Be’ based on the Date From and Date To fields in the item properties.
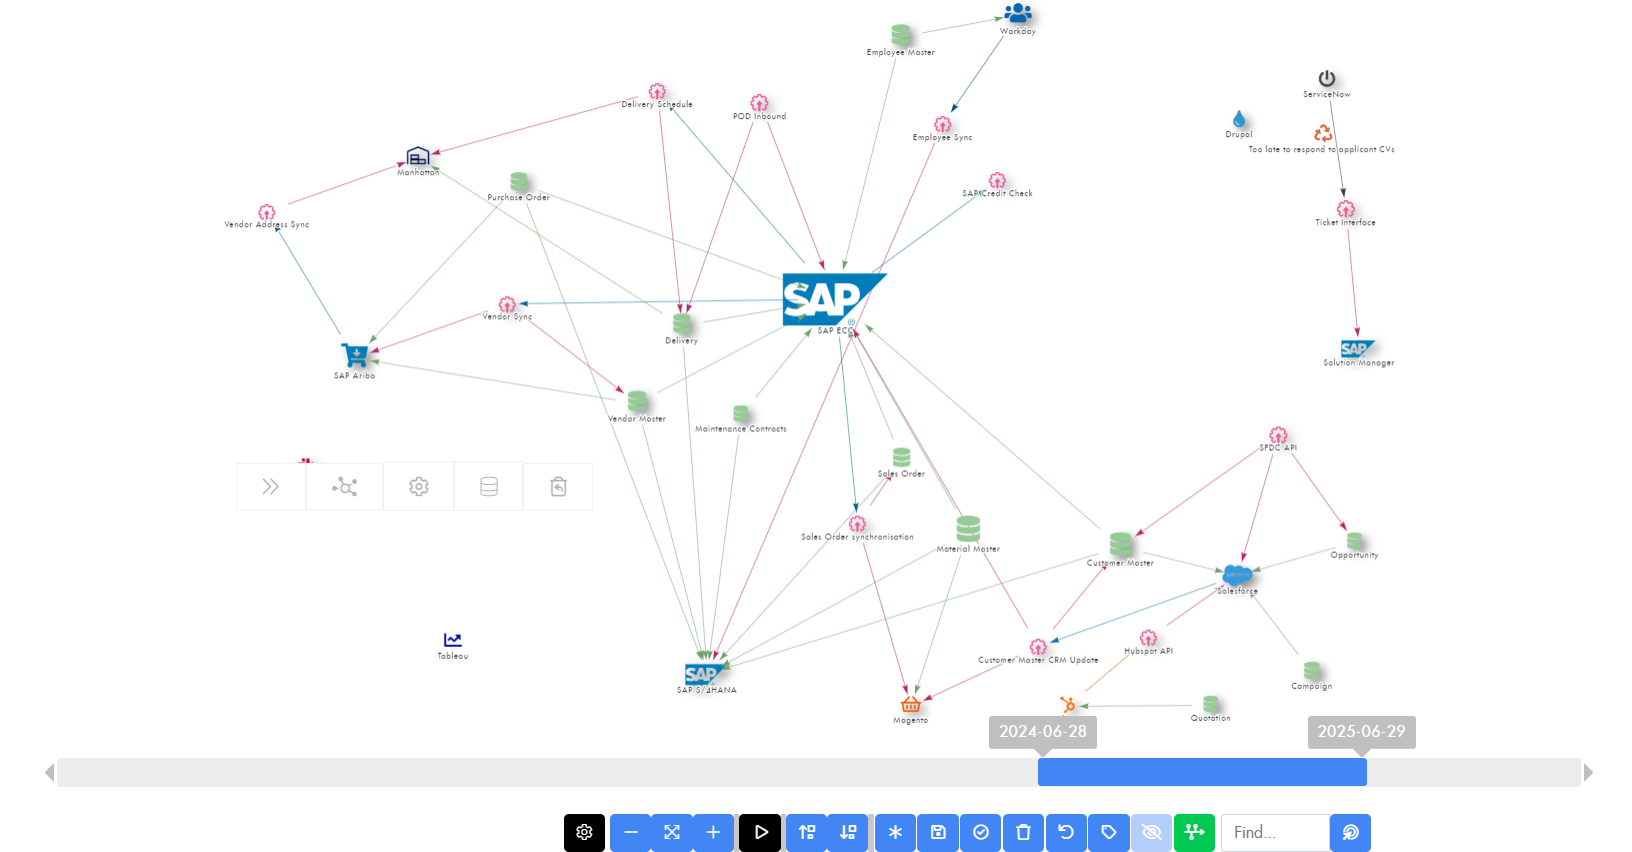
- Save for future recall, download a PNG snapshot to share.
- Build out the Applications, Interfaces and Data Entities within the Matrix, bring in properties, classifications and connected items.
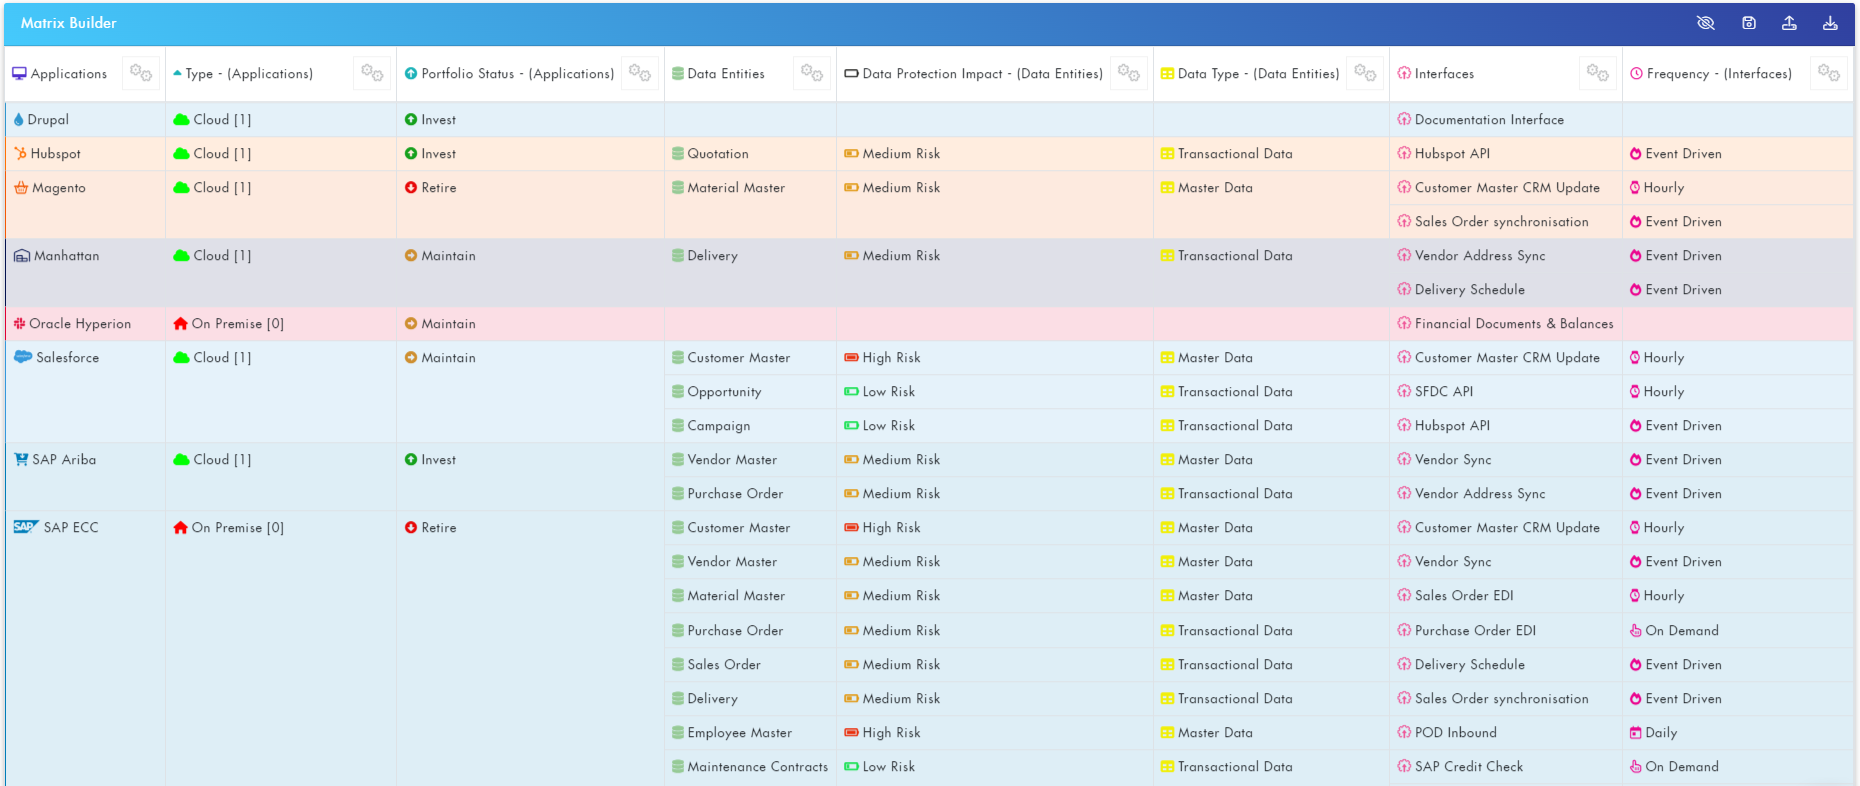
- Toggle Connection Names to see direction of information flow.
- Use filters to refine the view.
- Save for future recall and additional editing. Download a CSV to share.