How to see what is new and different in S/4HANA to help you develop a living blueprint and develop your S/4HANA business case
According to research, 63% of SAP customers don’t know what is different in S/4HANA, 75% don’t know what has been simplified and 80% don’t know what has been removed completely. Without this information, it is very difficult to build a compelling business case for migrating.
FusionGraph’s SAP Graph Dataset contains all of this information and can be used to present it in a way that is easy to understand.
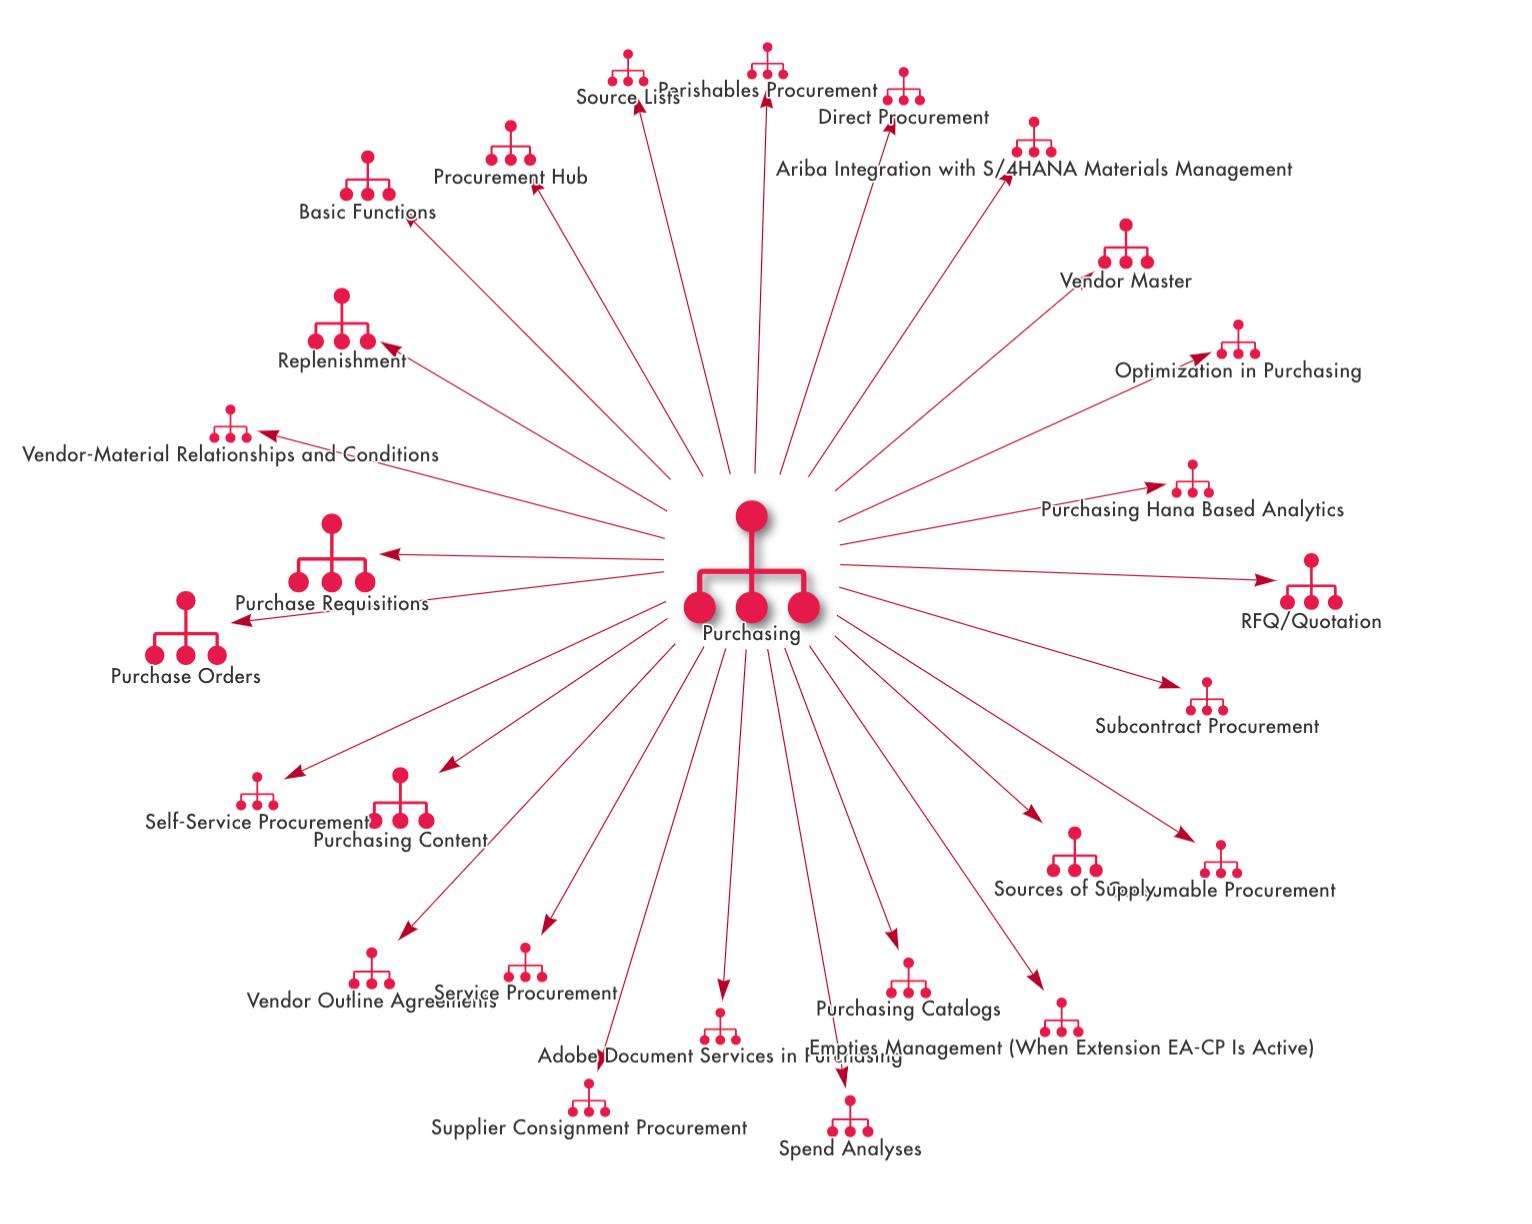
1. On the Canvas, select the area of the SAP Application Hierarchy you are interested in knowing more about. You can do this from the left-hand Layer Menu, or through the Search Menu. In the example, we have used Materials Management - Purchasing (MM-PUR).
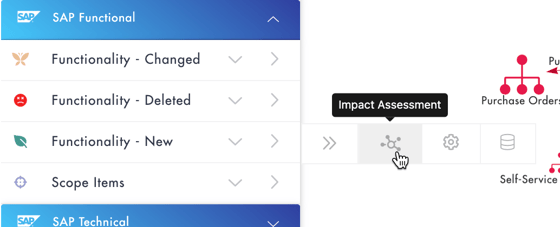
2. We can identify what is new or different in any or all of these areas by selecting individual items, or the whole graph (by deselecting all items). When you have made your selection, click on the Impact Assessment option in the SAP Functional Layer Menu.
3. Once selected, you will see a graphical view of all the new features and functions in this area of SAP. 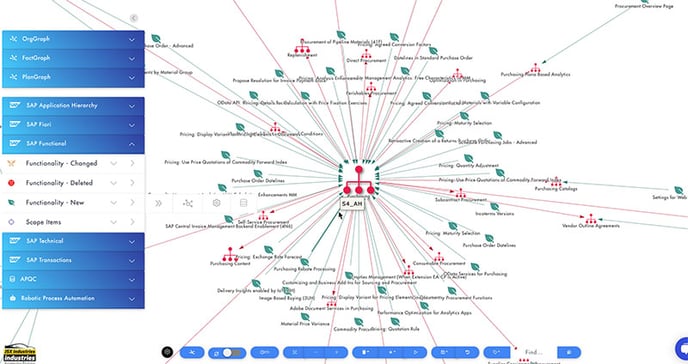
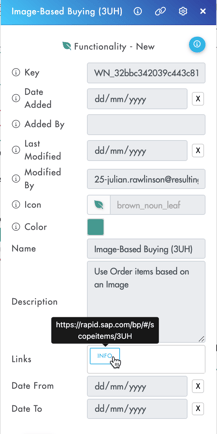
4. If you want to find out more about a particular area, double click and it will bring up more information, including which version it was introduced and a link to the relevant SAP documentation. If this functionality is something you are interested in, you can link it to items within your Knowledge Graph such as a Plan, a Solution, or a Business Process.
5. You can also filter the graph view by S/4 release by selecting from the versions available in the SAP Functionality Layer Menu filter.
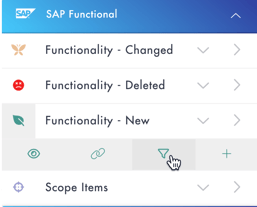
6. The Filter Menu will be displayed on the right-hand side of the screen and allow you to filter which items are displayed on the canvas. In the example, we have selected items that were introduced in the 2020 feature packs.
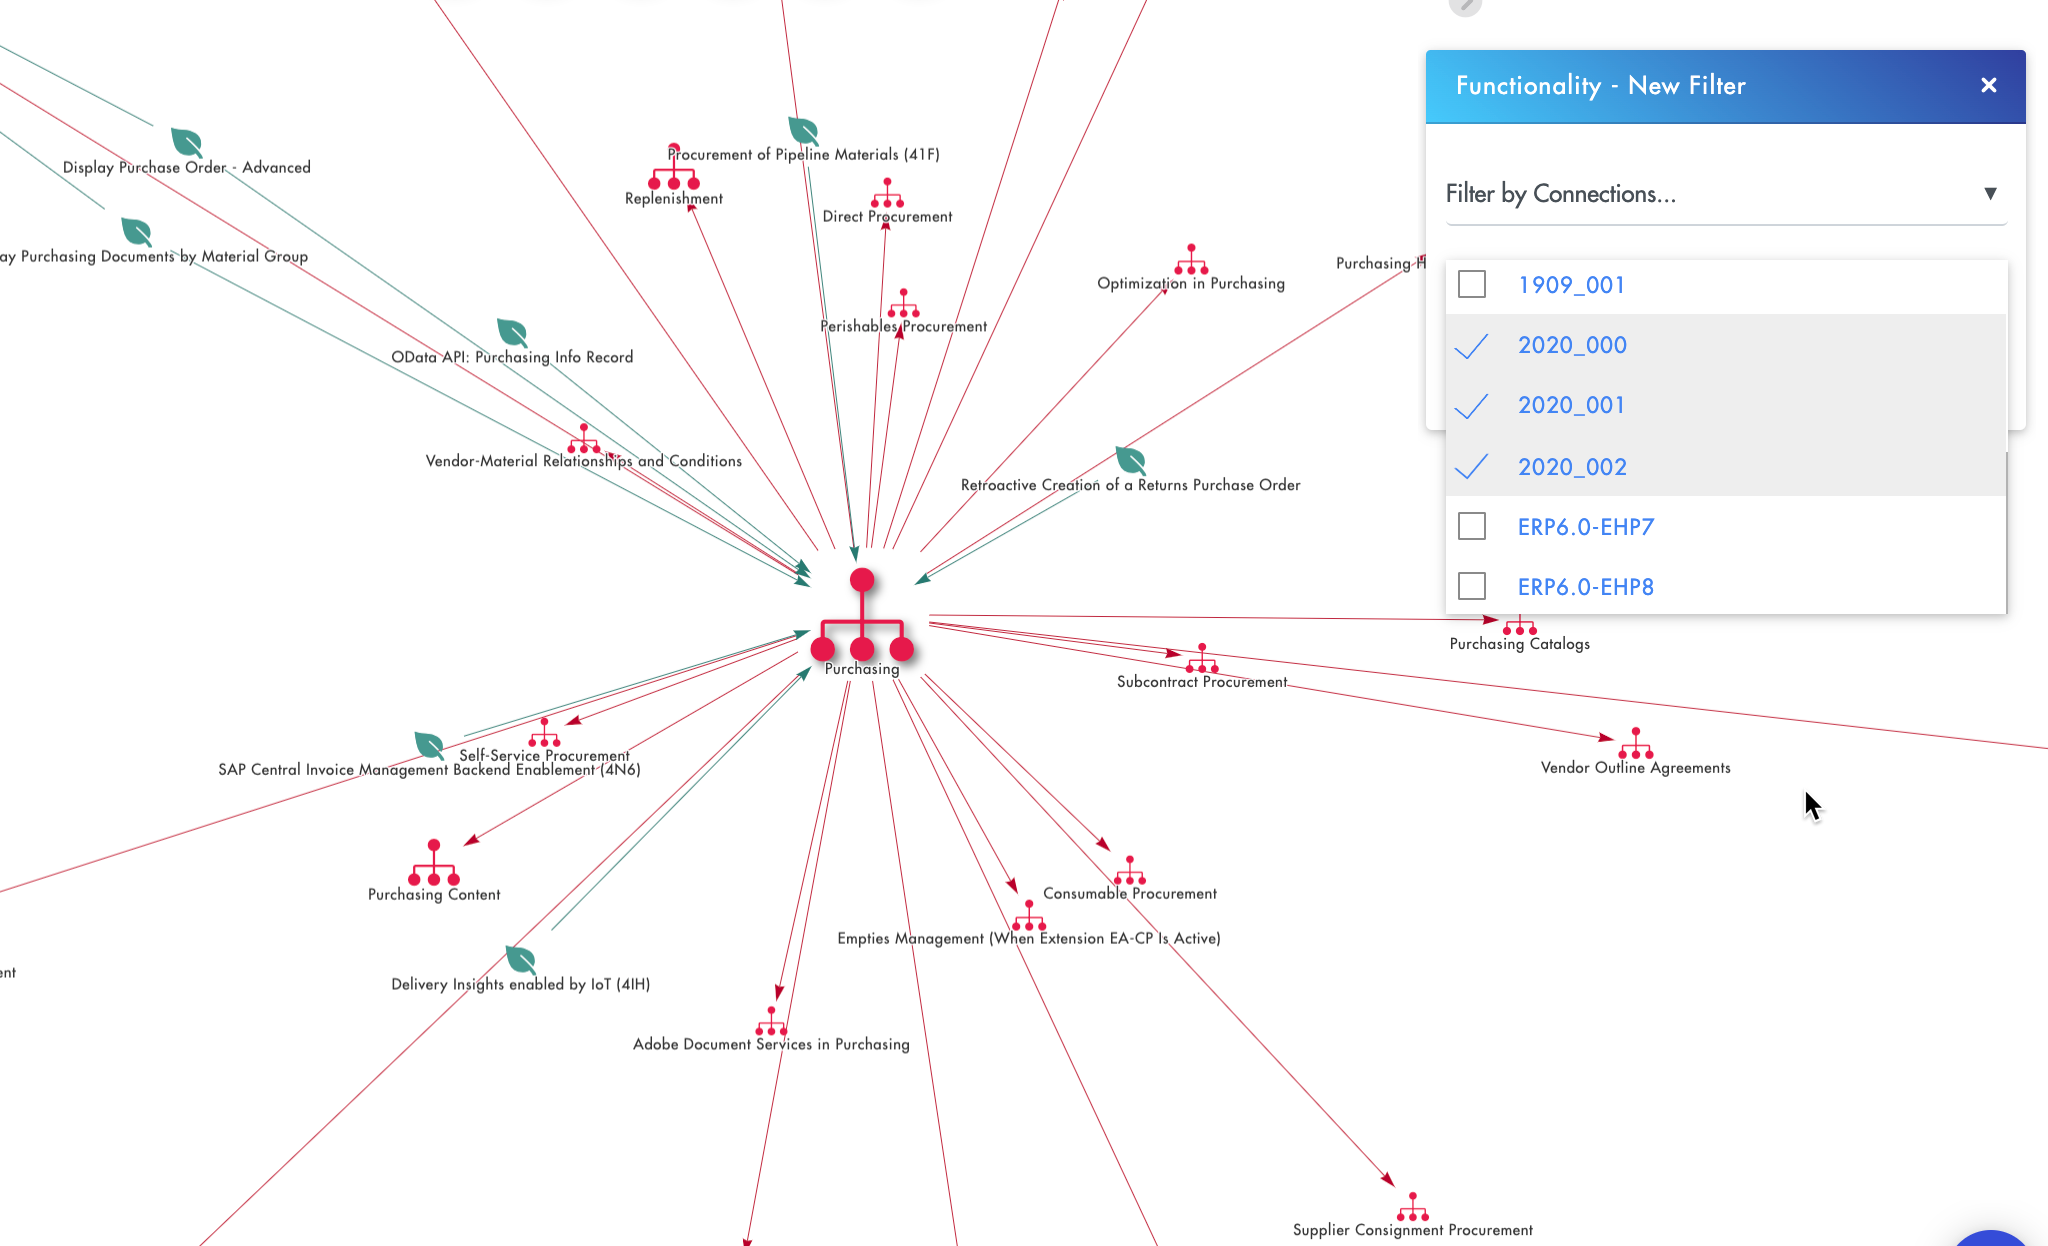
This allows you to continue to plot your roadmap once you are on S/4 and looking to migrate to the next version.
Functionality Classifications
It is now possible to right-click on golden data items such as SAP Functionality to view any assigned classification values. This is useful to view data such as the relevant from and to SAP versions that are applicable to SAP functionality like Fiori Apps or New / Changed / Deleted functionality.
Country Dependent Functionality
Country dependency information in SAP Functionality data is now available to be used in FusionGraph. If SAP functionality has been tagged with country specific data this can be viewed in the item properties:
A filter can also be applied to the Canvas to restrict the items to the countries of interest:
In the Matrix the Country Specific field can be added as a column so the data can be viewed and filtered there too:
Note: The country data has been provided by SAP and sometimes the formatting of it is not consistent. For example, United Kingdom could be written as United Kingdom or UK. Also, if the item is not specific to a country it will usually be tagged with "n/a" or "Not applicable".
Functionality Factory
A new SAP Functional data layer can be used to provide links to the Resulting Functionality Factory blogs. These provide useful information on how to implement various parts of SAP functionality and are directly linked to the appropriate part of the SAP Application Hierarchy.
Each one has a link to a Resulting blog about the particular subject area.
.png?height=120&name=fusion-graph-white%20(1).png)