The FusionGraph Canvas helps you to visualize the data held in FusionGraph whether this is information you have entered about your organisation, your Knowledge Graph, or the SAP and APQC Graph Datasets.
Menus and Controls
All of your primary navigation tools on the graph canvas are blue, making them easy for you to navigate.
.png?width=688&name=Screenshot%20(269).png) Layer Menus
Layer Menus
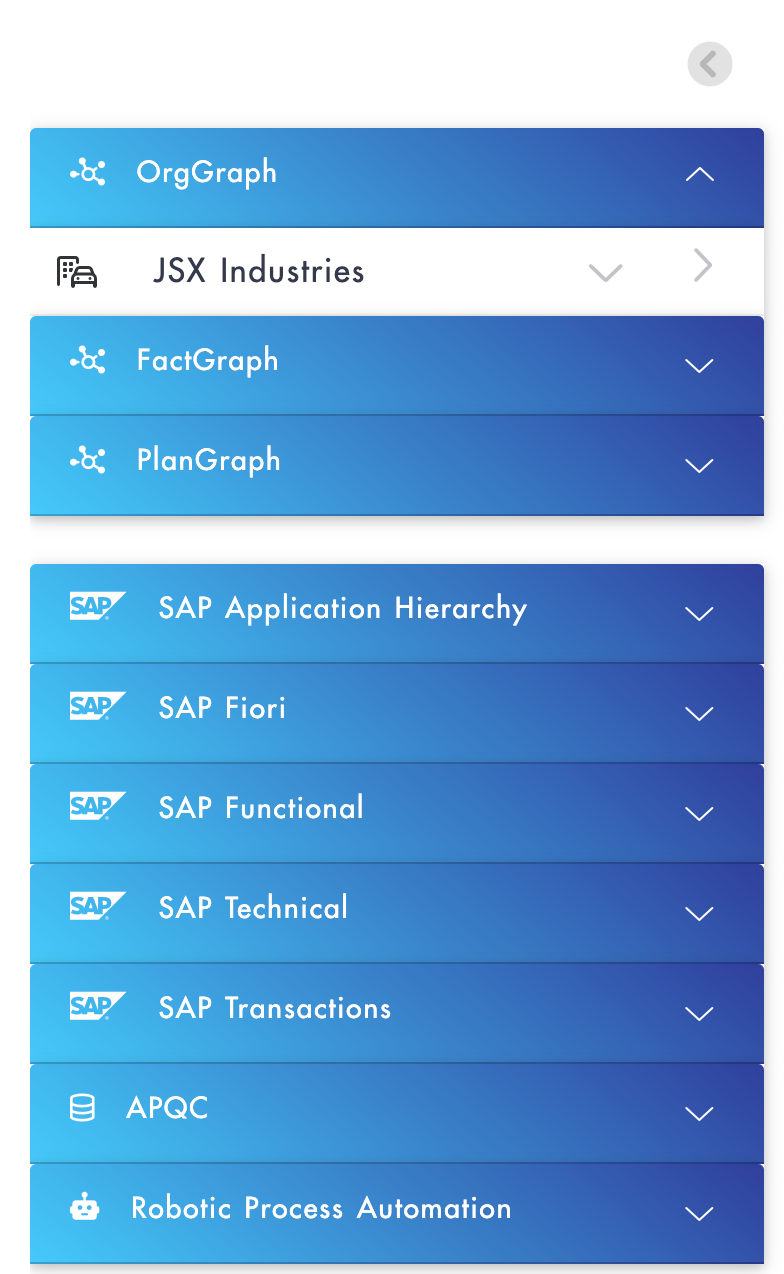
The Layer Menu on the left of the screen contains all the layers that you have set up in FusionGraph.
If you have a large complex graph on the canvas you can hide/show this menu by clicking the grey circle above the menu.
You can easily expand/collapse items by using the arrows on the right.
The menu is split into two sections; the Knowledge Graph and the Graph Datasets.
Knowledge Graph
Data stored in a knowledge graph is incredibly powerful - and it's why graph databases underpin new tech fields like AI and Machine Learning.
The Knowledge graph holds all the information about your business, from the applications you use. Not only does it hold this data, it interlinks each element with anything that it is related to; For example, you can see what applications support a business process and which employee uses those applications.
OrgGraph

OrgGraph outlines your business. Who you are?, where do you operate? and what do you do? This can everything from your strategic goals, the applications you run, the geographies that you operate in and your business processes.
FactGraph
FactGraph covers the other information about your business that is not usually captured in a formal way, 'tacit' information that some people may be aware of but everybody may need to know.
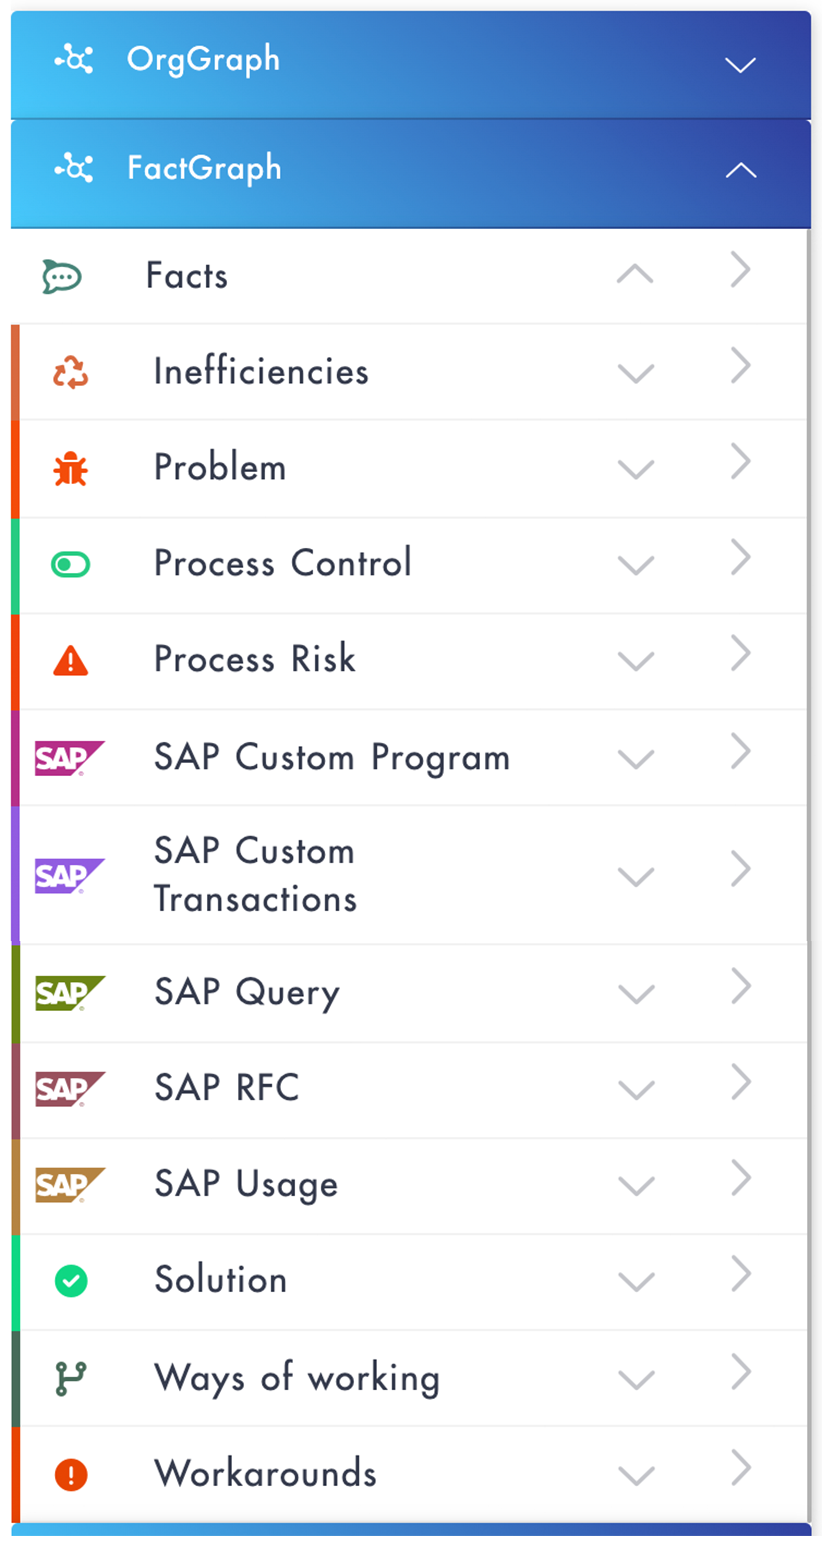
These can relate back to your OrgGraph for example where Workarounds are used in the business because the business process or application does not support the business, where problems or inefficiencies exist, and where process risks and c controls are in place.
This type of information can be crucial when developing roadmaps and plans to ensure that the right areas are targeted.
PlanGraph
Items in the PlanGraph, may nor may not happen. This can include Projects and Plans, or Business Benefits.
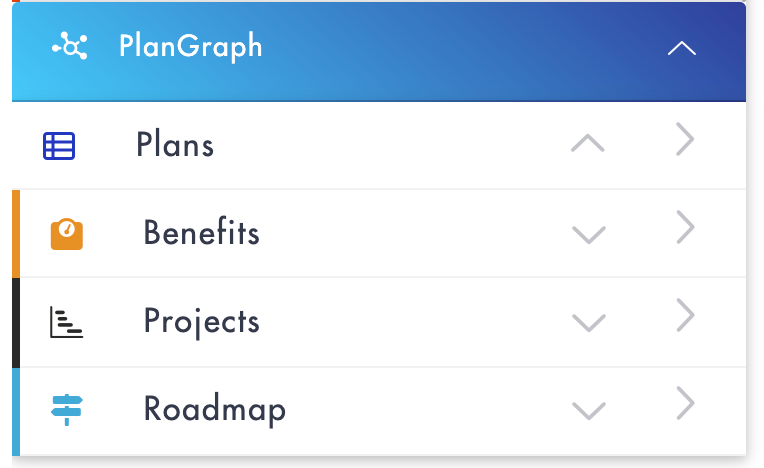
These can be connected up to the items in your OrgGpah or FactGraph.
Graph Datasets
We will provide curated datasets that educate your team to underpin transformation.
You can link this "Golden Data" to your Knowledge Graph data.
SAP

FusionGraph contains a number of datasets including.
- The SAP Application Hierarchy - everything that you get 'out of the box' - that you can display visually.
- Details of new features and changes from every version of S/4HANA and recent releases of ECC, including links to the relevant section in the SAP 'Whats New' viewer.
- S/4HANA Simplification Catalogue by S/4 version
- Fiori Apps Catalogue for S/4HANA by S/4 version
FusionGraph for SAP shows you what's new and different in every version of SAP S/4HANA and ECC.
APQC
FusionGraph contains the 19 variants of the APQC business process framework and access to over 2,600 KPIs. These can help you to understand what you do, how to measure your performance and help you to drive business best practices.

Canvas Menu
The canvas menu appears once you have selected something from the canvas and allow you to control one or more of the items on the canvas.
.png?width=353&name=Screenshot%20(268).png)
From left to right;
- The Delete button allows you to delete the selected item, all items but the selected item, all items, orphans or reference layer items.
- Add Items Above will display and parent items, items higher in the hierarchy.
- All Items below will display and child items, items lower in the hierarchy.
- Add Direct Connections will display all items, from any layer that have a direct connection to the item selected.
- Impact Assessment will analyse all the other layers and identify any connections. If you select this option the Layer Menu will turn green and indicate which layers have a connection.
- Edit will display the properties panel and allow you to edit the item.
You can read about the full functionality of the canvas menu here...
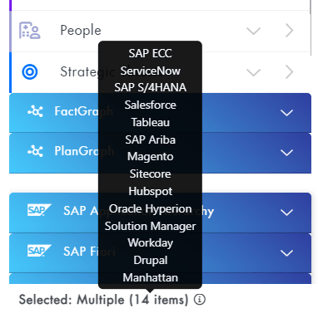
Item Selection
When selecting multiple items on the Canvas, the number of items currently selected in displayed and the info button generates a list of the selected items.
Canvas Toolbar
The controls toolbar is displayed at the bottom of the canvas and includes a number of options.
-1.png?width=636&name=Screenshot%20(269)-1.png)
From left to right;
- Admin controls (Admin view only)
- Zoom in and out of the graph
- Fit Graph to screen to reset the view after using the zoom in/out to get the best view of all items on your canvas
- Play/pause physics so your graph can move freely
- Select items upwards or downwards on the graph
- Freeze options to unfreeze any items
- Save the Canvas view to load up easily in future or download a PNG of your graph to use on reports and presentations
- Undo actions
- Toggle visibility of connection lines and labels
- Toggle visibility of inactive items
- Time machine can help you to see how your graph changes over time
- Search items on the canvas
You can read about the full functionality of the Canvas Toolbar here...